Examining C-store Shoppers From Pump to Register
NATIONAL REPORT -- What if you could dive inside the convenience store shopper's mind to understand the way he or she makes a purchase decision?
Mars Chocolate North America recently conducted such a study in partnership with a national c-store retailer. The "C-Store Discovery Project: Path to Purchase Study" (P2P Study) examines shopper behavior from the gas pump to the checkout and how merchandising influences buying decisions. The study examines shopping patterns, impact of stimuli to consumer engagement/dwell time and how retailers can use this information to create the most effective, profitable path.
"While this study's primary focus is confectionery, the results span well beyond our category, so retailers can apply learning throughout the store," said Larry Lupo, vice president of Sales Convenience & Retail, Mars Chocolate North America. "This research is just one example of how we're developing insights to help our retail partners grow their total business and maximize trips."
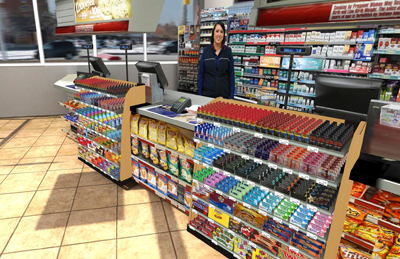
The test included nearly 1,800 consumers across the country in all geographic regions to match c-store demographics. Rather than utilize retail locations -- which potentially could disrupt business -- consumers visited a virtual reality store that simulates the shopping experience by using 3-D computer renderings. The flexibility of this Mars V-store enables testing multiple concepts, thus reducing the need to design and build several store planograms for live testing.
 "The Mars V-store offers valuable insights for a fraction of the cost, in a fraction of the time, without disrupting the actual retail store," Lupo explained.
In the study, each consumer shopped a virtual retail store with one of 12 different "cells," or configurations, of different merchandising situations. This simulation measured the effectiveness of: gasoline pump-toppers; exterior signage such as on windows; interior signage such as shelf signs and blades; and finally, front-end and checkout area configurations.
One of the cells represented the current signage for the national retailer, and this served as the "controlled" factor against which all the other cells were measured. Other cells included a mixture of existing merchandising elements for the retailer, plus variations of signage. Some formats included category and brand logos, while other signs featured actual product photos.
Optimal Merchandising Plan
"Through this comprehensive research conducted inside the virtual store, we've identified the most impactful merchandising situations to drive purchases," said Lupo. "Our c-store partner can now pick the top one or two and test them in-store."
Based on the findings, Mars has recommended that the retailer implement key signage and merchandising elements to draw shoppers into the store and drive conversion in aisle and at checkout. Results of the P2P Study focus on the following recommendations:
1. Use outside signage at the pump to encourage shoppers to visit the store/candy section. Shoppers who view signage on pumps and hose clamps are encouraged to visit the candy aisle and spend more on confections.
2. Avoid cluttered windows and doors with excess signage and allow for a store view. A clear view into the store makes it appear cleaner and more inviting. Window and door signs promoting confections drive traffic to the candy section and help stimulate category awareness and brand consideration.
3. Employ in-aisle signage to draw shoppers to the candy section. The study noted that in-aisle signage, in particular, drives higher than average sales levels for the total store, as well as for confections and chocolate candy.
4. Communicate brand and product imagery on in-aisle signage. In-store signage featuring product photography was most appealing to consumers, driving more conversion and recall than signs that just had words.
5. Placement of singles and sharing-size bars drives optimal checkout conversion. To drive the highest total front-end sales, as well as sales for front-end chocolate, place top-selling chocolate singles and sharing-size SKUs at the checkout.
"By testing a number of different scenarios, we were able to validate certain merchandising cells and discard others. While we anecdotally knew that some merchandising strategies worked, the research enables us to more definitively discard or uphold theories about traffic flow, signage, consumer preference and merchandising. We're adapting the research to make it very relevant for the retailer and its shoppers," Lupo noted.
"Our retail partner was pleased with the study. Together, we've already created a new front-end based on the study results, which will help capture more sales."
In addition, the study asked consumers which promotional elements influence their in-store purchases. Coupons were the clear incentive, as nearly half of the shoppers believe coupons would inspire purchases. Other influencing drivers include in-store displays (30 percent), frequent buyer/loyalty programs (30 percent), gas pump signage (24 percent), store window signage (20 percent) and in-store promotional signage (20 percent).
Shopper Segments
The study grouped consumers according to demographics and how they shop inside the store. Five "clusters" of key shopper segments emerged:
• Back of Store Browser: spends the most time in the store – 63 percent more time than other segments -- and makes the most stops.
• Checkout Connoisseur: heavy front-end buyers, they also shop the back of the store thoroughly.
• Quick Checkout: shops the front-end heavily, but spends less time than average in the store.
• In and Out: similar to Quick Checkout, but they buy fewer front-end items.
• Uninvolved: disengaged shoppers who aren't very interested in shopping in the c-store.
This segmentation will enable retailers to develop merchandising programs to drive sales to particular segments. For example, to reach the consumers who are "Checkout Connoisseurs," retailers should offer high-margin, high-impulse items at the registers.
Study Parameters
Conceived in December 2010 during talks between Mars and the retailer, the P2P Study evolved over several months. Agency partner Red Dot created the virtual environment to resemble a store in the national retailer's chain. The V-store included all product categories and merchandising elements to make it "shoppable" and simulate a real in-store experience.
The actual testing took place during the summer of 2011. Analyzing the data remains an ongoing process, as the retailer, Mars and Red Dot can examine the information in a variety of ways.
While Mars has no current plans to conduct another massive c-store path-to-purchase study in 2012, the company is interested in discussing merchandising opportunities with retailers. Later this year, Mars plans to summarize the P2P Study results and share the findings with c-store retailers.
-- Contributed by Tim Quinn, VP of Trade Development, Mars Chocolate North America