Since the 2008 Saturation Study
 Convenience Store News published its last Saturation Study in 2008. The research report showed the population-to-convenience store ratios for each state and several metro markets. In this column, we take a look at the latest population figures and store numbers to see what’s changed or stayed the same over the last five years.
The population-to-store ratio is a fundamental measure of demand. All other things being equal, markets with higher ratios are better for operators because more potential customers are available for each convenience store. The national population-to-store ratio in 2012 was 2,100-to-1. In other words, the number of people in the United States divided by the number of convenience stores across the country yielded 2,100 people per store.
Using the national average as a benchmark, markets with ratios greater than 2,100 are better than the national average, and markets with ratios less than 2,100 are worse. For example, in 2012, Alaska (3,621), California (3,485) and the District of Columbia (3,455) had the highest population-to-store ratios, while Vermont (1,028), Mississippi (1,084), and Alabama (1,229) had the lowest.
The change in this ratio since 2008 is one of the most important observations. The table below shows the percentage increase or decrease in the state population-to-store ratios from 2008 to 2012. Positive increases in the ratio mean the state’s population grew faster than the number of convenience stores. Therefore, these markets should be favorable for new store development.
2008 to 2012 Change in Population-to-Store Ratio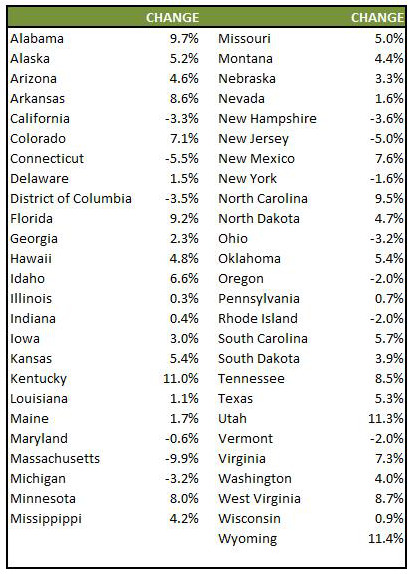
To show the geographic patterns, these trends are also illustrated in the map below. The darker-colored states are those with the highest positive change in the population-to-store ratio. Wyoming (up 11.4 percent), Utah (11.3 percent) and Kentucky (11 percent) are the nation’s top three states. The states with negative change either lost population or had store growth outpacing population. The states with the greatest negative change are Massachusetts (minus 9.9 percent), Connecticut (minus 5.5 percent), and New Jersey (minus 5 percent).
2008 to 2012 Change in Population-to-Store Ratio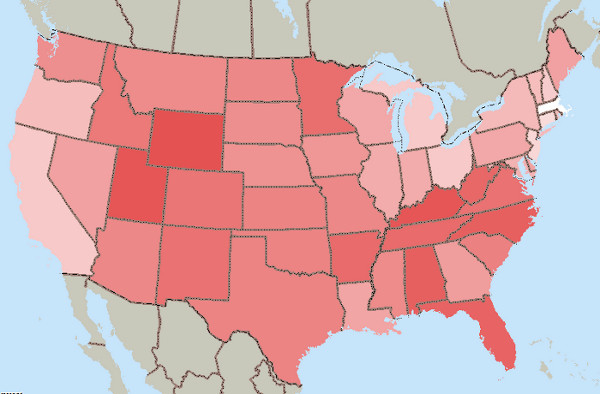
The national average population-to-store ratio has remained fairly static since 2008. So, the changes illustrated here are revealing those states with better or worse potential market demand in the four years since 2008.
Convenience Store News will conduct an update of its exclusive Saturation Study in 2014, with the findings appearing in the October 2014 issue.
Robert E. Bainbridge is an author, instructor and expert witness in the appraisal and valuation of convenience stores and gas stations. He can be reached at [email protected] or (541) 823-0029. Find more valuation information at www.cstorevalue.com.
Editor's note: The opinions expressed in this column are the author's and do not necessarily reflect the views of Convenience Store News.